In a spin: what all cyclists should know about pedalling cadence

Cadence and efficiency
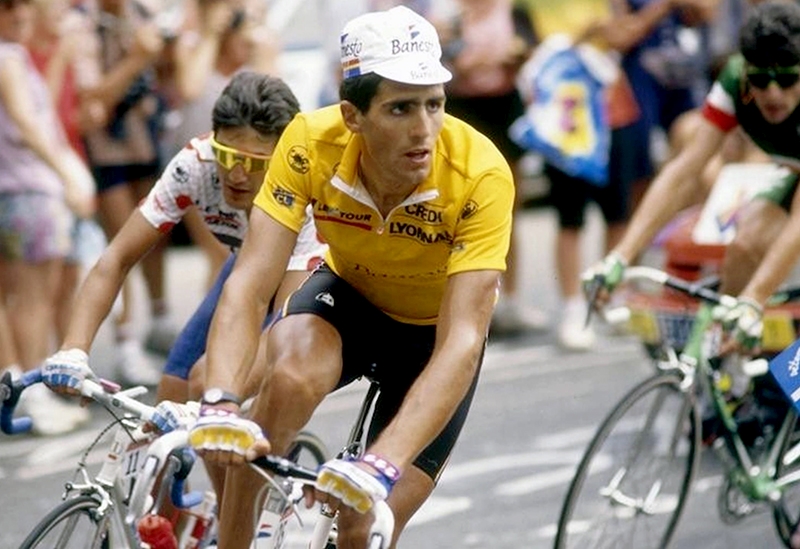
Box 1: the power of indurain.
Power, force and cadence
Figure 1: relationship between peak torque, peak power and pedalling cadence (3).
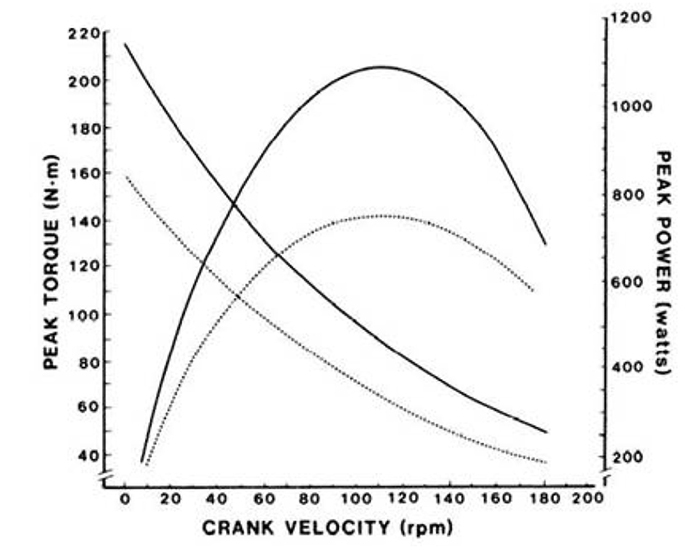
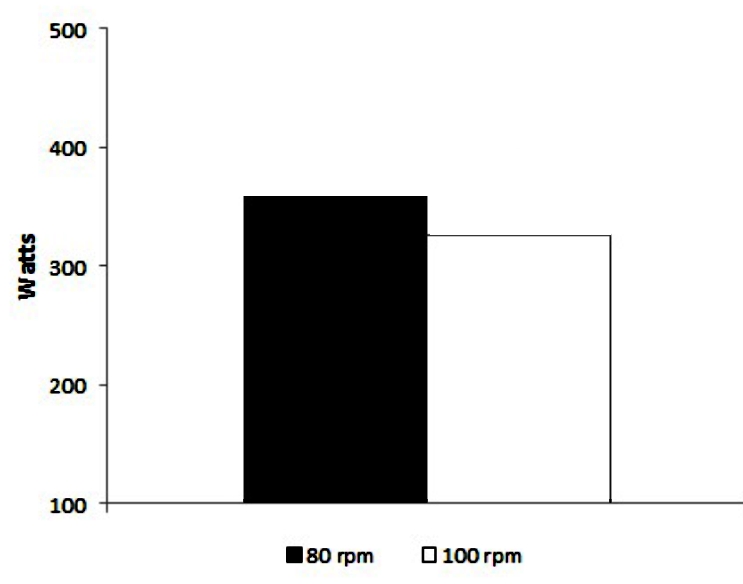
Table 1: Difference between 80rpm and 100rpm during prolonged sub-maximal cycling
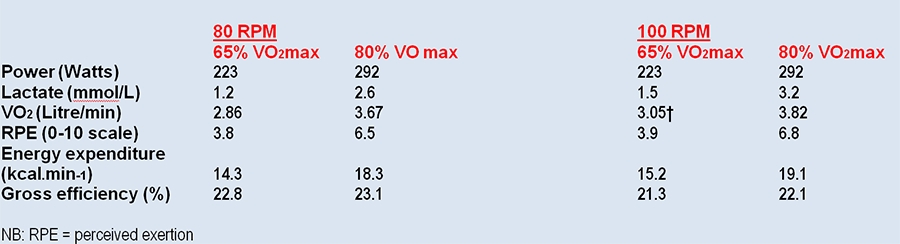
Figure 2: Effects of cycling cadence on maximal power during exercise to exhaustion
Freedom of choice
Cadence and hills.
- *The relationship between cadence and gross efficiency appears to be unchanged when cycling uphill – ie, lower cadences are likely to be more efficient and thus save energy in the longer run;
- *Despite this, the greater forces needed to cycle uphill means that while a lower cadence may be more energetically efficient, it might result in more lactate accumulation. Given that (on longer climbs), a significant accumulation of lactate will slow the cyclist significantly and may even force him/her to stop, losing a little efficiency by using a higher cadence (which reduces the forces on muscle fibres) is a price worth paying;
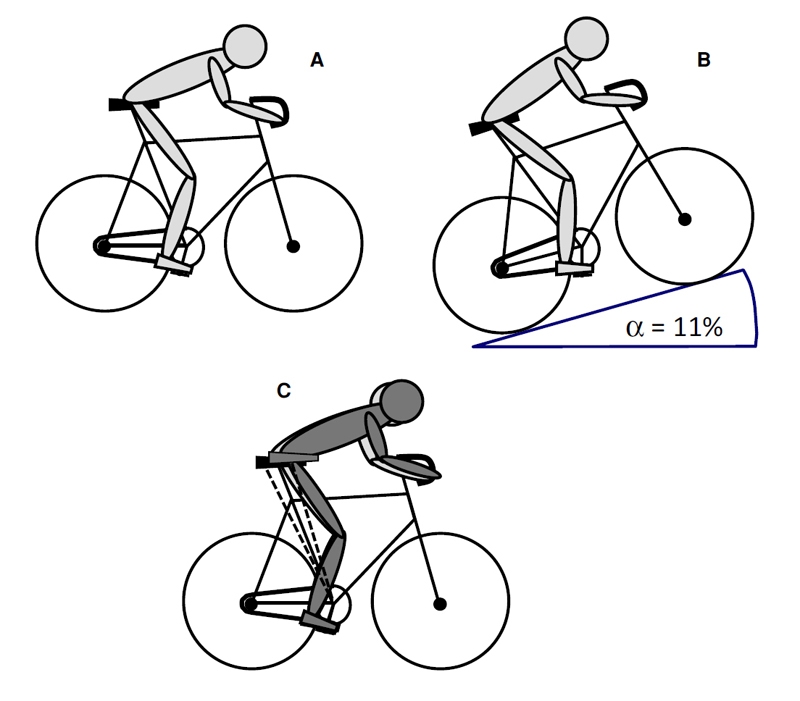
- *The cyclist’s body position during seated climbing doesn’t appear to affect efficiency but a more upright stance might help lower lactate accumulation.
Figure 3: Gross efficiency, incline and seat position (13)
Training your GE
- An intervention group who performed half-squats, four sets of 4 repetitions maximum, 3 times per week for eight weeks, as a supplement to their normal endurance training.
- A control group who continued their normal cycling training during the same period with no strength training.
Summary and conclusions
- Int J Sports Physiol Perform. 2012 Dec;7(4):397-400
- J. Appl. Physiol 2005; 98:2191-2196
- Med Sci Sports Exerc 2000; 32(7): 1281-1287
- Journal of Sports Science and Medicine (2014) 13, 114-119
- Acta Physiologica Scandinavia 2002; 176(3), 185-194
- J Appl Physiology 1975; 38(6), 1132-1139
- Int J Sports Physiol Perform. 2009 Mar;4(1):3-17
- Experimental Brain Research 2008; 186 (3),365-373.
- Int Rev Sport Exerc Psychol. 2012 Mar;5(1):44-66
- Int J Sports Physiol Perform. 2012 Dec;7(4):375-81
- Eur J Appl Physiol. 2012 Jul;112(7):2433-41
- Med Sci Sports Exerc. 2013 May;45(5):920-6
- Eur J Appl Physiol (2011) 111:2885–2893
- J Strength Cond Res. 2005 Nov;19(4):826-30
- J Strength Cond Res. 2010 Aug;24(8):2157-65
- Int J Sports Med. 2009 Jan;30(1):27-32
- Scand J Med Sci Sports. 2011 Apr;21(2):250-9

Andrew Hamilton
Andrew Hamilton BSc Hons, MRSC, ACSM, is the editor of Sports Performance Bulletin and a member of the American College of Sports Medicine. Andy is a sports science writer and researcher, specializing in sports nutrition and has worked in the field of fitness and sports performance for over 30 years, helping athletes to reach their true potential. He is also a contributor to our sister publication, Sports Injury Bulletin.
Register now to get a free Issue

Latest Issue

- High Intensity Training
- Sports Psychology
- Ultra-endurance Performance
- Strength Training & Injury Rehab
- Endurance Techniques
Subscribe Today

- Unlimited Access
- Monthly Magazine
- Back Issue Library
- Email Newsletter
Quantifying intensity, practical guide on how to identify your own dominant side and bring the other side up to par, swimming performance: is bilateral breathing a must, vo2max is a poor predictor of performance, but computing your velocity at vo2max can pay big benefits, warm ups: key mobility exercises to prepare the body for action, newsletter sign up, testimonials, dr. alexandra fandetti-robin, back & body chiropractic, elspeth cowell msch dpodm srch hcpc reg, william hunter, nuffield health, further reading, can your pedalling technique make you a more efficient rider, cycling training: how reducing your drag will improve your cycling performance, cyclists: position yourself for performance, efficiency matters, editor's picks, endurance and strength: you have the best of both worlds, training intensity: is higher better, even for beginners, endurance performance: can a short, sharp shock work wonders, high-intensity training: are sprint intervals overhyped, mass with class: why sleep matters, further reading.

Tuning your training: should you factor in body type?

The perfect training plan: human vs. artificial intelligence

Triathlon performance: the king of disciplines

The test of time: self-monitoring for runners

Coaches Testimonials
- Weekly Magazine
- Online Library

- Hip Injuries
- Tools and Technology
Keep up with latest sports science research and apply it to maximize performance
Today you have the chance to join a group of athletes, and sports coaches/trainers who all have something special in common...
They use the latest research to improve performance for themselves and their clients - both athletes and sports teams - with help from global specialists in the fields of sports science, sports medicine and sports psychology.
They do this by reading Sports Performance Bulletin, an easy-to-digest but serious-minded journal dedicated to high performance sports. SPB offers a wealth of information and insight into the latest research, in an easily-accessible and understood format, along with a wealth of practical recommendations.
*includes 3 coaching manuals
Get Inspired
All the latest techniques and approaches
Sports Performance Bulletin helps dedicated endurance athletes improve their performance. Sense-checking the latest sports science research, and sourcing evidence and case studies to support findings, Sports Performance Bulletin turns proven insights into easily digestible practical advice. Supporting athletes, coaches and professionals who wish to ensure their guidance and programmes are kept right up to date and based on credible science.
More from us
© 2023 sports performance bulletin, part of green star media ltd. company number: 3008779.

Pedalling technique and the Tour de France – watch and turn

Senior lecturer for the School of Exercise and Health Sciences, Edith Cowan University
Disclosure statement
Chris Abbiss does not work for, consult, own shares in or receive funding from any company or organisation that would benefit from this article, and has disclosed no relevant affiliations beyond their academic appointment.
Edith Cowan University provides funding as a member of The Conversation AU.
View all partners
Professional cyclists, such as those riding in this year’s Tour de France , have repeated the same circular pedalling action countless times. But does this mean they’ve developed a more effective pedalling action? It should.
The bicycle is an amazing feat of engineering that allows force generated by our muscles to be transferred from the pedals to the bicycle crank and through the chain to the rear wheel, resulting in movement.

Although considerable advances have been made in cycling equipment and technologies, this general design has changed very little since the development of the chain-driven bicycle more than 120 years ago.
But a noticeable and extremely influential advance in the bicycle was the development of gears, which gives cyclists greater control over their pedalling rate or cadence at any given speed.
As a result, the pedal rate, or [cadence](http://en.wikipedia.org/wiki/Cadence_(cycling%29), of professional cyclists is often close to 90 or 100 revolutions a minute (rpm) irrespective of whether they’re riding on flat or hilly sections of a race.
Due to this high cadence, cyclists riding the 21 stages of the Tour de France – which takes around 85 hours to complete – will perform more than 500,000 crank revolutions.

Numerous factors influence the optimal pedal rate during cycling and can explain the lower pedal rates often seen in recreational cyclists (60-80 rpm). Cycling at lower cadence is generally more efficient, meaning less energy or oxygen is required to cycle at a given intensity.
It therefore may seem strange that elite cyclists will cycle at slightly higher cadences than recreational cyclists, given this requires greater oxygen.
Why do they do it? Cycling at a lower cadence may result in greater fatigue within the neuromuscular system and alterations in force distribution throughout the pedal cycle.
The repeated circular action of cycling may seem relatively smooth and consistent; but the force produced by cyclists varies dramatically throughout the entire rotation of the bicycle crank.
Talking torque
The majority of force, or torque, produced in cycling is applied to the pedals during the downward movement of the crank and pedals. During this movement the muscles of the lower limb, particularly the gluteal and quadriceps , are contracting to straighten the leg. These muscles are extremely powerful, allowing high forces to be generated that can be transferred to the chain and rear wheel.
During the upward movement of the crank, numerous muscles, such as hip flexors and hamstrings , contract in order lift the limb towards the cyclists’ chest. The muscles involved in this movement are considerably weaker, and as a result the torque produced by the cyclists during the upwards motion of the crank is relatively low.
In fact, the slow movement of the limb during the upward movement of the crank may result in force being produced in the opposite – wrong – direction (known as negative torque . This negative torque is opposing the momentum of the crank and may therefore slow down movement.
To date, numerous technologies and methodologies have been designed or trialled in order to limit this negative torque. One of those includes the use of clip in shoes/cleats and pedal systems .
Such systems allow cyclists to pull on the pedal during the upward phase of the pedal cycle, resulting in a more even distribution of torque.
When cycling without clip-in shoes, cyclists are required to produce the majority of torque during the downward phase of the pedal cycle (as shown by the big green rectangles in the video below), which can rapidly fatigue the muscles involved.
The use of these shoes is likely to be most beneficial when riding at high power outputs or when rapidly changing cadence, such as during sprinting or when standing out of the seat.
But in order be able to pull the pedal up during the upward phase of the movement, cyclists need to train the relevant muscles. In order to do this, many riders complete drills in which they cycle with just one leg at a time .
While this may be beneficial at very low intensities, the muscles that extend our leg ( gluteal and quadriceps ) are considerably stronger than those involved in pulling our leg upwards.
Therefore, the downward phase of the cycle movement is still extremely important. Indeed, during certain cycling tasks such as uphill climbing, even elite cyclists can be seen stomping on the pedals.
Furthermore, as we fatigue we tend to shift our body closer to the handlebars in order to maximise the recruitment of our very strong muscles involved in this downward force.
But riders who care about their performance shouldn’t forget about pedalling technique, even when – in fact, especially when – things get hard.
Further reading: Conversation articles on the Tour de France
- Sport science
- Tour de France
Program Manager, Teaching & Learning Initiatives
Lecturer/Senior Lecturer, Earth System Science (School of Science)
Sydney Horizon Educators (Identified)
Deputy Social Media Producer
Associate Professor, Occupational Therapy
What Is a Good Cadence for Cycling?
The answer may surprise you… choosing a good cadence is a little more complicated than it looks.
Do you find yourself either grinding up a climb or spinning so fast that you can’t put enough power through the pedals? If this sounds familiar, then you could be using the wrong cadence on the bike.
Naturally, we all have preferred cadences — you may feel more comfortable adopting a low cadence, similar to Alberto Contador, or you may prefer a faster cadence, such as Chris Froome.
Technically, there is no “perfect cycling cadence.” But there are good cycling cadence guidelines that can help you become more efficient and comfortable when cycling.
This blog post will explain what cycling cadence is, what guidelines we recommend, and then we’ll finish with a few cadence training drills.
What is cycling cadence?
Cycling cadence, also known as pedal rate, is the total number of revolutions your pedals make while riding per minute. But don’t worry — you don’t need to count these yourself.
You can buy a cadence sensor to track your revolutions per minute (RPM). Most power metres and smart trainers also have built-in sensors.
Cadence influences your cycling economy, power output, perceived exertion, and fatigue on the bike [ 1 ]. For example, adopting a lower cadence allows you to be smoother when you stand up out of the saddle, grind up a steep hill, or can be used to develop muscular strength with specific intervals. Whereas a higher cadence recruits more of the aerobic and cardiovascular system — great for climbing longer hills and sprinting.
While you can easily change up your cadence on certain parts of your ride, at other times, your cadence will naturally drop, even when using the lowest gear selection on steep climbs. For this reason, you should train at a mix of cadences for those instances when you need to increase or decrease your RPM — more on that shortly.
What is a good cycling cadence?
This is where things get a little complicated — current research shows conflicting results regarding the best cadence for cycling. Largely, this is because there are numerous definitions of the phrase “optimal cadence,” which describes energetic cost, perception of effort, and muscular strength [ 2 ].
Instead of thinking about cadence as a number you should stick to it no matter what — you should be able to adapt on the fly to the demands of the road and train a variety of cadences so you can cope with variations when it comes to crunch time in an event or race.
But for the sake of argument, and especially for beginners, a good average cadence for cycling is anywhere between 70 and 90 RPM, especially for shorter zone 2 rides and rides exceeding 4 hours in duration [ 3 ].
What is the best cycling cadence?
Numerous studies report lower cadences of 70 to 90 RPM to be the most efficient at improving cycling economy, reducing fatigue, and lowering metabolic energy demands. However, cadences between 100 and 120 RPM improve sprint cycling performance, and slightly lower cadences of 90 to 100 RPM are most suited to road time trials [ 1 , 4 ].
We’re sorry to disappoint, but there is no one best cycling cadence for road riders — it depends on what type of riding you’re doing, the gradient of the road, and your strength on the bike.
While you can aim for an average cadence of between 70 and 90 for endurance rides, there are going to be times when lower cadences will not allow you to produce the required power output on steep climbs.
So, it’s important to adapt your cadence when necessary. Pedalling in the wrong cadence bracket will either reduce power output, increase energy expenditure, or increase your metabolic and aerobic costs when not necessary.
You should train at a mix of different cycling cadences to improve performance.
Cycling cadence training — how to get started
Cycling cadence drills can be performed as an individual workout (e.g., low or high cadence hill repeats) or added during or at the end of a zone 2 endurance ride.
During any one given ride, you’ll likely need to switch cadences to attack a climb, accelerate back up to speed after cornering, or maintain a higher RPM on longer, steeper climbs.
Cycling at higher cadences reduces the force used per pedal stroke, lowering muscular fatigue and allowing riders to utilise type 1 slow twitch muscle fibres instead of type 2 fast twitch fibres [ 6 ].
Muscle fibre distribution is seen as an important determinant of the energetics of pedalling [ 7 ]. However, slow twitch fibres are preferential because these are aerobic — they contain more mitochondria and myoglobin and provide you with the energy for those long days in the saddle.
Fast twitch fibres, on the other hand, are used for short bursts of speed and energy. You’ll still use fast twitch fibres on your ride (when attacking a steep section of a climb or sprinting, for example), but for the majority of the ride, you’ll be using those type 1 slow twitch fibres.
While maximal strength capacity positively impacts the lower extremity muscular activity during cycling — useful for steep gradients and other moments where a lower cadence is preferred [ 5 ], a mid-high cadence of between 70 and 90 RPM is preferred for most riders. This cadence bracket, in theory, should recruit slow twitch muscle fibres for all-day performance in the saddle.
You also need to consider in training what your goal event looks like and what your strengths/weaknesses are!
- What are the main demands of the course? > Climbing, flat or undulating.
- How long is the event? > Short duration races (~60minutes) might not be influenced by lower cadences as much as long races due to the fatigue.
- Is there a long climb or sprint that I will need fresh legs for at the end? > a higher cadence may help you conserve muscular strength when required at the end of the race.
- Are you riding/racing multiple days? >accumulating load over multiple days at a cadence you are not used to will affect how you recover and perform on the bike the next day/s.
This is where a coach will be able to target your training specifically to make sure you can cope with the demands of the terrain and style of ride/race.
There is no such thing as a perfect cadence
According to the research, there is no best cadence for cycling — in any one given ride, you’ll need to adopt a mix of cadences, whether that’s climbing a steep hill, accelerating out of a slow and sharp corner, or keeping up with the group on the flats.
Training at a mix of cadences is highly recommended — you’ll be better suited when you need to adapt your RPM on your next ride.
What is the average cadence in the Tour de France?
The average cadence in the Tour de France depends on the stage and event. But you can expect professional riders to ride anywhere between 75-95 RPM (on average).
Is higher cadence better cycling?
Cycling at higher cadences reduces muscular fatigue and increases aerobic recruitment, allowing you to ride more efficiently for longer.
What is the most efficient cadence?
There is no perfect cadence. However, several studies reported an average cadence between 70 and 90 RPM to be the most efficient at reducing fatigue, increasing cycling economy, and lowering metabolic demands.
References:
- Abbiss, C.R., Peiffer, J.J. and Laursen, P.B., 2009. Optimal cadence selection during cycling. International SportMed Journal , 10 (1), pp.1-15.
- Ansley, L. and Cangley, P., 2009. Determinants of “optimal” cadence during cycling. European Journal of Sport Science , 9 (2), pp.61-85.
- Lucia, A.L.E.J.A.N.D.R.O., Hoyos, J.E.S.U.S. and Chicharro, J.L., 2001. Preferred pedalling cadence in professional cycling. Medicine and science in sports and exercise , 33 (8), pp.1361-1366.
- Bieuzen, F., Lepers, R., Vercruyssen, F., Hausswirth, C. and Brisswalter, J., 2007. Muscle activation during cycling at different cadences: effect of maximal strength capacity. Journal of Electromyography and Kinesiology , 17 (6), pp.731-738.
- Talbot, J. and Maves, L., 2016. Skeletal muscle fiber type: using insights from muscle developmental biology to dissect targets for susceptibility and resistance to muscle disease. Wiley Interdisciplinary Reviews: Developmental Biology , 5 (4), pp.518-534.
- Umberger, B.R., Gerritsen, K.G. and Martin, P.E., 2006. Muscle fiber type effects on energetically optimal cadences in cycling. Journal of biomechanics , 39 (8), pp.1472-1479.
What Is the Tour de France Average Speed?
We examine the average speed and other metrics of the world’s best cyclists. How would you stack up?

Gear-obsessed editors choose every product we review. We may earn commission if you buy from a link. How we test gear.
We all know that the pro cyclists that race in the men’s Tour de France are the best in the world. We also know that they’re fast— really fast. Have you ever wondered about the Tour de France average speed, though, and how you’d fare against a pro? Well, now you can see for yourself.
Average Time Trial Speed

A Tour pro’s ability to produce more power for longer means that he would complete a 30K time trial about 20 minutes faster than the average rider. In other words, he’s really hammering.
Average Rider: 19 to 20 mph
Tour Pro: 29 to 31 mph
Average Speed on Flat Terrain

Even on flat land, a pro’s average speed in the Tour de France needs to be way up there in order to stay in the race. In fact, it’s usually about double that of an average rider.
Average Rider: 17 to 18 mph
Tour Pro: 25 to 28 mph
Maximum Sprint Power

Sprinters generate incredible amounts of power in the final 15-second dash for the line. A rider like Mark Cavendish might hit 1,500 watts at the end of a flat field sprint.
Average Rider: 600 to 800 watts
Tour Pro: 1,200 to 1,400 watts
Average Speed Over Cobblestones

The Tour de France often features at least one section of cobblestones , known locally as pavé (though sometimes that’s exchanged for a stretch of gravel) . On a tough section, pros can average an incredible 22 to 24 mph.
Average Rider: 14 to 16 mph
Tour Pro: 22 to 24 mph
Average Resting Heart Rate

Team EF Education-EasyPost utilized WHOOP straps during the 2020 Tour to collect detailed biometric data on the athletes 24/7 over the course of the entire 21-stage race, with remarkable results. The data showed an average resting heart rate of 42 beats per minute for the team before the start of the Tour, and 40 bpm after the first rest day. And in other jaw-dropping heart rate stats, team cyclist Neilson Powless spent 38 percent of Stage 8 that year in the 90- to 100-percent zone for his max heart rate .
Average Rider : 60 to 100 bmp
Tour Pro : ~40 bmp
Sandwiches Consumed

Soigneurs (all-purpose team assistants) make lunches for everyone on the team, including the staff. With about 12 to 15 staffers supporting a given team’s nine riders in France, that’s a lot of bread and a lot of sandwiches consumed over the course of three weeks.
Average Rider: 1 to 3 sandwiches
Tour Pro: ~30 sandwiches
Daily Bottles of Drink Mix Guzzled

Depending on conditions, you might mix one or two bottles during one of your ride. A Tour de France soigneur might mix between 40 and 120 bottles for the team on each stage, which means an individual rider may throw back up to a dozen bottles or more.
Average Rider: 1 to 2
Tour Pro: 4 to 13
How Long it Takes to Climb the Col du Tourmalet

A pro climber will probably average about 350 to 375 watts on the climb up the Col du Tourmalet , one of the most famous climbs not just in the Tour, but in the entire cycling world. An ordinary rider would generate closer to 175 to 200—which means the Tour’s top climbers could ascend the Col nearly twice during your trip to the top.
Average Rider: 115 minutes
Tour Pro: 60 minutes
Bikes at Your Disposal

Depending on the rider and the team’s bike sponsor, most pros come to the Tour with an aero road bike for flatter stages, a climbing bike for the mountains, and a time-trial bike—not to mention spares. A general classification contender like Tadej Pogačar might have two or three of each.
Average Rider: 1 to 2 bikes
Tour Pro: 4 to 5 bikes

Since getting hooked on pro cycling while watching Lance Armstrong win the 1993 U.S. Pro Championship in Philadelphia, longtime Bicycling contributor Whit Yost has raced on Belgian cobbles, helped build a European pro team, and piloted that team from Malaysia to Mont Ventoux as an assistant director sportif. These days, he lives with his wife and son in Pennsylvania, spending his days serving as an assistant middle school principal and his nights playing Dungeons & Dragons.
.css-1t6om3g:before{width:1.75rem;height:1.75rem;margin:0 0.625rem -0.125rem 0;content:'';display:inline-block;-webkit-background-size:1.25rem;background-size:1.25rem;background-color:#F8D811;color:#000;background-repeat:no-repeat;-webkit-background-position:center;background-position:center;}.loaded .css-1t6om3g:before{background-image:url(/_assets/design-tokens/bicycling/static/images/chevron-design-element.c42d609.svg);} Cycling Tips

How to Avoid Bonking on Rides

5 Spring Training Mistakes

Not Reaching Your Goals? Here are Twelve Fixes.

How to Plan a Century Ride Route

Hill Repeats to Help You Dominate Mountain Races

How to Tell if You’re Ready for a Century Ride

15 Ways to Cycle Faster

How to Improve Cadence, According to Pros

How to Corner on the Bike, According to a Pro

How to Release Your Diaphragm and Why You Should

How to Find the Right Bike Seat Height for You
Tour de France average speed: How fast are riders at the Tour?
How fast do professional riders do the lap around France?
- Sign up to our newsletter Newsletter

The general trend at the Tour de France , since its start in 1903, is that the speed of the riders is going up.
This has happened due to multiple reasons. Mainly it is due to the quality of kit getting better and better every year as science and technology become more and more involved in the sport.
>>> Tour de France facts: stats from the world’s biggest bike race
Bikes and kit becoming as aerodynamic as it is possible to be along with new materials that are faster through the air than human skin itself have changed bike racing hugely in recent years.
On the other side of this, some of the average speeds in past Tours have potentially been due to leading riders having a little extra help than just aero kit and fast rolling tyres.
You won't be surprised to know that the fastest Tour de France on record belongs to a certain Lance Armstrong .
The American former rider had all seven of his Tour titles taken away from him after it was exposed that had doped during all his victories.
Get The Leadout Newsletter
The latest race content, interviews, features, reviews and expert buying guides, direct to your inbox!
He completed the 2005 race with an amazing average speed of 41.7km/h, which is over one km/h faster than the modern day riders who ride with much faster kit.
>>> Tour de France bikes: Who’s riding what in 2020?
On the flip side, the slowest ever Tour was in 1919, after World War One. The race was won by Belgian Firmin Lambot with an average speed of 24.1km/h.
In the last 10 years the pace hasn't differed too much, staying around the 39 - 40km/h mark, but it does look to be steadily increasing as the technology and training means that riders can go faster than ever before.
The fastest ride in the last 10 years goes to Chris Froome 's last overall victory in 2017.
The race only had three summit finishes and multiple flatter stages and a lot of long descents along with two time trials, which explains the higher than normal speed.
The last two editions of the race have both been around 200km shorter than the 2017 race.
Tour de France average speed (last 11 editions)
2009, Alberto Contador : 40.03km/h
2010, Andy Schleck : 39.59km/h
2011, Cadel Evans : 39.79km/h
2012, Bradley Wiggins : 39.93km/h
2013, Chris Froome: 40.68km/h
2014, Vincenzo Nibali : 40.68km/h
2015, Chris Froome: 39.64km/h
2016, Chris Froome: 39.63km/h
2017, Chris Froome: 41.00km/h
2018, Geraint Thomas : 40.23km/h
2019, Egan Bernal: 40.58km/h
Thank you for reading 20 articles this month* Join now for unlimited access
Enjoy your first month for just £1 / $1 / €1
*Read 5 free articles per month without a subscription
Join now for unlimited access
Try first month for just £1 / $1 / €1
Hi, I'm one of Cycling Weekly's content writers for the web team responsible for writing stories on racing, tech, updating evergreen pages as well as the weekly email newsletter. Proud Yorkshireman from the UK's answer to Flanders, Calderdale, go check out the cobbled climbs!
I started watching cycling back in 2010, before all the hype around London 2012 and Bradley Wiggins at the Tour de France. In fact, it was Alberto Contador and Andy Schleck's battle in the fog up the Tourmalet on stage 17 of the Tour de France.
It took me a few more years to get into the journalism side of things, but I had a good idea I wanted to get into cycling journalism by the end of year nine at school and started doing voluntary work soon after. This got me a chance to go to the London Six Days, Tour de Yorkshire and the Tour of Britain to name a few before eventually joining Eurosport's online team while I was at uni, where I studied journalism. Eurosport gave me the opportunity to work at the world championships in Harrogate back in the awful weather.
After various bar jobs, I managed to get my way into Cycling Weekly in late February of 2020 where I mostly write about racing and everything around that as it's what I specialise in but don't be surprised to see my name on other news stories.
When not writing stories for the site, I don't really switch off my cycling side as I watch every race that is televised as well as being a rider myself and a regular user of the game Pro Cycling Manager. Maybe too regular.
My bike is a well used Specialized Tarmac SL4 when out on my local roads back in West Yorkshire as well as in northern Hampshire with the hills and mountains being my preferred terrain.

Giant filed a suit against Stages in February and four team members left the latter to join Giant
By Michelle Arthurs-Brennan Published 25 April 24

Cameron Wurf is both a member of Team Ineos Grenadiers and an accomplished professional long course triathlete who has racked up numerous World Tour and Ironman race finishes across his career.
By Kristin Jenny Published 24 April 24
Useful links
- Tour de France
- Giro d'Italia
- Vuelta a España
Buyer's Guides
- Best road bikes
- Best gravel bikes
- Best smart turbo trainers
- Best cycling computers
- Editor's Choice
- Bike Reviews
- Component Reviews
- Clothing Reviews
- Contact Future's experts
- Terms and conditions
- Privacy policy
- Cookies policy
- Advertise with us
Cycling Weekly is part of Future plc, an international media group and leading digital publisher. Visit our corporate site . © Future Publishing Limited Quay House, The Ambury, Bath BA1 1UA. All rights reserved. England and Wales company registration number 2008885.
Efficient Cyclist

From Past to Present: Average Tour de France Speeds
The Tour de France, the world’s most prestigious and grueling cycling race, has captivated audiences for over a century. Spanning three weeks and covering thousands of kilometers, the Tour de France is a true test of endurance, strategy, and sheer athletic ability. One of the most intriguing aspects of this iconic race is the average speed achieved by the peloton over the years.
The overall trend of winner’s average speed has steadily increased during the Tour’s history. In this article, I explore the factors that have contributed to its continual increase.

Table of Contents
The Early Years: Humble Beginnings
The Tour de France was first held in 1903, and the average speeds achieved in those early editions were significantly lower compared to modern standards. Factors such as the heavy steel bicycles, rough road conditions, and limited technological advancements contributed to relatively slow average speeds. For many of those early years, average speeds hovered around 25 kilometers per hour, with individual stages often taking several hours to complete.
The winner of the very first 1903 Tour de France achieved only 25.7 km/h average speed, while the slowest race was just 24.1 km/h in 1919.
In the early years of the Tour, the sport was very much one of breakaways. Race reports suggest that there were hardly any pelotons back then, which would have increased the speed considerably. Being in the front allowed leading riders the clearest view ahead, and would ensure that, after being delayed by a mechanical or a puncture (very common back then), they would have other strong riders around them. And there was presumably quite a lot of time spent fixing the mechanical issues, which was included in the total time.
Until 1910, there were no high mountains in the Tour, so you can imagine the average speeds would have been even lower if they had to climb, too.
Advancements in Technology
Advancements in technology have had a profound impact on cycling, revolutionizing the sport and pushing the boundaries of what is possible in terms of speed.
Lightweight equipment
The development of lightweight bicycles has been a game-changer. With the introduction of materials like carbon fiber, bike frames have become significantly lighter, while maintaining strength and rigidity. This reduction in weight allows riders to accelerate more effortlessly and tackle climbs with greater ease.
Aerodynamics
Aerodynamics have also become a crucial focus in bike design. By utilizing wind tunnel testing and computational fluid dynamics, engineers can optimize the shape of bike frames, wheels, and other components to minimize drag. This results in more streamlined and efficient designs, reducing the resistance cyclists face when riding at high speeds. The integration of components, such as internal cable routing and hidden brakes, further improves the aerodynamic performance of modern bicycles.
It’s not only about bikes, either. Cycling clothing, helmets, shoes etc. also have a huge influence on aerodynamics .
Gear systems have seen significant advancements as well. The derailleur was only introduced in the Tour de France in 1937 – it was all single-speed before then. The Tour’s founder Henri Desgrange has famously said “I still feel that variable gears are only for people over 45. Isn’t it better to triumph by the strength of your muscles than by the artifice of a derailer?”
The introduction of index shifting has revolutionized gear changes, providing precise and instantaneous shifts at the touch of a button. This allows riders to maintain their momentum and power output, resulting in smoother transitions between gears.
Then came electronic shifting. Its impact is far less than that of indexed shifting but it still adds further improvements: It eliminates the need for manual adjustments and reduces the risk of misshifting, providing riders with more confidence and focus on their performance.
Wheels, an essential component of a bike, have undergone substantial improvements. Up until 1934 bicycle rims were all wooden – previously metal rims had been banned. Wooden rims tend to have more flex, which saps power.
Aluminum rims were standard for more than half a century; carbon fiber wheels only became mainstream in the pro cycling in the late 90s to early 00s. Carbon fiber wheels are lighter, resulting in improved climbing speeds. Their lightweight construction also allows for the creation of deep aerodynamic profiles, which can accommodate more material without adding substantial weight. Such wheels are standard on flat stages, as they reduce drag.
Then there are improvements in tires, offering reduced rolling resistance, which can make a significant impact, especially on the climbs, when aerodynamic drag matters less.
Moreover, the progress made in hub designs and bearing technologies has significantly reduced friction, resulting in improved overall efficiency of wheelsets.
Data-driven performance
Data-driven performance in pro cycling has revolutionized the way teams and riders approach training, racing, and performance analysis.
In the old days, cycling heavily depended on subjectivity and intuition, with limited access to measurable metrics. But with the advent of advanced technologies and the proliferation of cycling data sensors, the sport has undergone a significant transformation. Nowadays, riders and teams have an abundance of data at their disposal, encompassing metrics such as power output, heart rate, cadence, speed, and even muscle monitoring. This wealth of data is gathered during training rides, races, and even within controlled laboratory settings.
This helps coaches, and riders gain deep insights into performance, identify strengths and weaknesses, optimize training programs, and make strategic decisions during races. The result is more precise and individualized training plans, race strategies, and equipment choices, leading to improved performance and thus, higher speeds.
The understanding of sports science, training methodologies, and nutrition has also played a vital role. Athletes now benefit from access to state-of-the-art training programs, scientific testing, and advanced nutritional strategies aimed at optimizing their performance. The focus on recovery, specialized training camps, and individualized coaching has propelled riders to attain heightened levels of physical and mental readiness, ultimately resulting in faster average speeds.
Race Tactics and Strategies
Race tactics and strategies have also evolved over time, leading to faster racing. The introduction of team-based racing, with riders working together to protect their leaders and create tactical advantages, has significantly influenced the pace of the peloton.
This evolution took the better part of the century: from basically solo breakaway riding in the early 1900s to ‘one-man teams’, such as in Bartali/Coppi and later Mercx, times, to full-fledged team tactics from the late 20th century onwards. This meant more coordinated team efforts, for example utilizing domestiques to support their leaders in the mountains, providing pacing, protection, and strategic assistance. That allows leaders to save effort for when it really matters, and ride at higher speeds.
Route distance
The race distance has trended down throughout the 20th century, and I wonder if that may have contributed to the increases in average speeds. See the graph below. (The three outliers are the very first three years of the Tour.)

Similar Posts

Overview on Bike Drivetrain Efficiency
It’s no secret that bicycle drivetrain efficiency is crucial for optimizing power transfer and enhancing performance. It lets you convert pedalling force into forward motion with as small a loss as possible. An efficient drivetrain minimizes energy losses, enabling riders to achieve faster speeds with less effort. Components such as the chain, crankset, cassette, derailleurs,…

Can Listening to Music Enhance your Cycling Performance?
Can the rhythm of music harmonize with the cadence of my pedal and somehow elevate my cycling performance? Here I’ll explore the science behind the connection between music and cycling performance. I’ll delve into the contrasting effects of music on aerobic and anaerobic performance, explore how music influences distance perception, and examine the impact of…

The Evolution of Bicycle Brakes
Generally brakes are not the first thing that comes to mind when talking about bikes. Typically we like to boast about stuff that gives us speed, looks good or is comfortable: the frame, the wheels, the handlebar. Aerodynamics. Rolling resistance. Drivetrain friction. But stopping isn’t as sexy, though it saves our lives. Let’s see what…

Myths about Titanium Frames Comfort and Ride Quality
When it comes to choosing a bike frame, riders often find themselves inundated with information and marketing claims about various materials. One material that has gained considerable attention and a devoted following is titanium. While titanium has some good characteristics, such as corrosion resistance, fatigue life, and aesthetics, titanium bike frames have been touted as…

Most Successful Grand Tour Bikes in History
Throughout its history as of mid-2023, the Tour de France has been held 110 times, the Giro d’Italia 106 times, and the Vuelta a Espana 77 times. The Tour has seen 36 different bicycle brands emerge as winners, at least 39 brands have triumphed in the Giro, and the Vuelta has had at least 26…

What is the True Cost of Owning a Bike?
We often deceive ourselves about the true expenses associated with our bikes. We convince ourselves that if a new bike costs, say $3000, then that’s the total expenditure. However, the reality is more complex: the cumulative expenses of wearable parts can add up significantly over time. So, what is the actual cost of owning a…
Leave a Reply Cancel reply
Your email address will not be published. Required fields are marked *
Save my name, email, and website in this browser for the next time I comment.
Tour de France power analysis: Tadej Pogačar's record-breaking ascent of the Col de Peyresourde
Slovenian averages 6.5 watts per kilo for 24 minutes and 450 watts for the decisive attack

Stage 8 of this year's Tour de France took us to the Pyrenees, via the Port de Balès and the Col de Peyresourde for the first half the Pyrenean doubleheader that is proving the first true GC test of the race.
On a day where Jumbo Visma ' shook the tree ' and their Slovenian leader, Primož Roglič looked every bit the leader at Junbo-Visma, Thibaut Pinot suffered dramatically , Adam Yates fought valiantly and Egan Bernal clung on bravely .
However it was another Slovenian, Tadej Pogačar , who looked the strongest of the stage. Just a day after losing 1:21 in the crosswinds of stage 7, he attacked three times on the Peyresourde and upon finally being allowed to go clear, put in a record-breaking ride, ascending the climb in 24 minutes and 35 seconds.
In doing so, he beat the former record of 25:20 set by Alexander Vinokourov and Iban Mayo in 2003. In fact, according to Climbing Records database, Porte, Landa, Quintana and Roglič managed to meet or beat the 17-year-old time, too.
More impressively, they did so with a headwind.

Much of the record-breaking time can be attributed to the early pace-setting by Jumbo-Visma, as Tom Dumoulin's sacrificial ride put several riders into difficulty to the benefit of his team leader, Roglič, isolating Yates and distancing many of the GC contenders.
The break down of the climb

Both Pogačar and Rigoberto Urán have uploaded their rides to Strava, so using Strava's segment compare tool, it's clear the point at which Pogačar managed to distance his rivals. At the maximum, he managed to put a minute into his rivals, before his rivals pulled back 12 seconds in the final kilometre.
Get The Leadout Newsletter
The latest race content, interviews, features, reviews and expert buying guides, direct to your inbox!

Pogačar's climb can be split into three sections: Pre-attack, the attack and post-attack.
Pre-attack is where he followed in the wheels of Tom Dumoulin's pace-setting, trying his luck twice with tentative attacks and being followed by his rivals. The attack itself occurred when Pogačar successfully gapped his opponents and Roglič decided not to follow and instead allow his teammate to come back. The post-attack came when Pogačar subsequently got away and settled into his rhythm.
Prior to the successful attack, Pogačar's power was understandably less consistent due to following the wheels and trying two tentative accelerations. This section lasted approximately 13:20 and he averaged 410 watts; an impressive number for anyone, and even more impressive considering Pogačar is touted - by ProCyclingStats - to weigh just 66kg.
This puts his power at 6.21 W/kg. Impressive, but overshadowed entirely by what was about to come.

The attack itself was a 17-second affair. The Slovenian maxed out at 880 watts (13.3 W/kg), and averaged 643w (9.74 W/kg) over the period, before settling into his rhythm.

The post-attack moment is where the Slovenian really did the damage. This section lasted 10 minutes and 25 seconds, throughout which the power was essentially a time trial effort, a very linear execution of 447 watts (6.77 W/kg).
Unsurprisingly, Pogačar took the Strava KOM ( Peyresourde depuis Balés ) along the way, with a total average of 429 watts (6.5 W/kg).
Quite the warm up

This wasn't his first effort of the day. With three mountains on the route profile for the day, Pogačar tackled the first ascent - the Col de Menté - at a comparative amble, averaging (a still enormous) 369 watts (5.6 W/kg) for 20:33.

The second mountain - the Port de Balès - was harder again, but still within the Slovenian's FTP - which using Strava's Zone Distribution tool, we approximate at 410 watts (6.2 W/kg). For this ascent, he averaged 379 watts for 46:56, including the climb-proper - 10 kilometres at 8% - where he spent 30 minutes at 404 watts (6.1 W/kg).
For a reference of just how good this is, anyone who's spent time racing on Zwift may be familiar with the five Zwift Power categories (A+, A, B, C and D). A+ is the highest here, and to get yourself into this category, you'll need an FTP of 4.6 W/kg. Pogačar did 6.7 W/kg for 24 minutes, at the end of a four-hour mountain stage, on the eighth consecutive day of the world's hardest bike race.
He wasn't done yet
He then went on to descend the Peyresourde - 7km at an average of minus 8% - in under six minutes, before finishing off the stage by taking two more Strava KOMs ( Estervielle-Loudenvielle GBP and Aranvielle ) riding at 443 watts for a final 3:46, to finish the stage 38 seconds ahead Romain Bardet, and 40 seconds ahead of the rest of his GC rivals.
Pogačar now sits ninth on GC, 48 seconds down on leader Adam Yates.

Thank you for reading 5 articles in the past 30 days*
Join now for unlimited access
Enjoy your first month for just £1 / $1 / €1
*Read any 5 articles for free in each 30-day period, this automatically resets
After your trial you will be billed £4.99 $7.99 €5.99 per month, cancel anytime. Or sign up for one year for just £49 $79 €59

Try your first month for just £1 / $1 / €1

Josh is Associate Editor of Cyclingnews – leading our content on the best bikes, kit and the latest breaking tech stories from the pro peloton.
Josh has been with us since the summer of 2019 and throughout that time he's covered everything from buyer's guides and deals to the latest tech news and reviews. On the bike, Josh has been riding and racing for over 15 years.
He started out racing cross country in his teens back when 26-inch wheels and triple chainsets were still mainstream, but he found favour in road racing in his early 20s, racing at a local and national level for Somerset-based Team Tor 2000.
These days he rides indoors for convenience and fitness, and outdoors for fun on road, gravel, 'cross and cross-country bikes, the latter usually with his two dogs in tow.
Mike's Bikes launches 'mega sale' with discounts on everything sitewide
Best cycling trousers of 2024: Six options so you can ride to work and not get changed
POC Aspire cycling glasses review: A sturdy and stylish modern classic
Most Popular
- Race Previews
- Race Reports
- Race Photos
- Tips & Reviews
From Cobbles to Cubicles: Charting the Champions in the Roubaix Showers
Lily williams commits to human powered health until 2026, paris roubaix femmes 2024 race preview, elisa longo borghini sets sights on ardennes, skips paris-roubaix femmes, michaela drummond triumphs in inaugural région pays de la loire tour for women.

Email: [email protected]
The Evolution of Speed in the Tour de France

Mathew Mitchell
- Published on June 23, 2023
- in Men's Cycling

One of the most intriguing aspects of the Tour de France, beyond the dazzling victories and dramatic rivalries, is the evolution of the race’s average speed. Throughout its history, a multitude of factors have contributed to significant changes in the pace of the peloton, from technological advancements to race strategies. Let’s embark on a journey through the annals of the Tour to examine this transformation.
Table of Contents
The early editions
The early years of the Tour de France were characterised by lengthy stages often exceeding 400 km, rudimentary bicycles, and rugged roads, which resulted in a slow pace compared to today’s standards. Maurice Garin, the winner of the first Tour in 1903, achieved an average speed of 25.7 km/h, or approximately 16 mph. This may seem leisurely in the modern era, but given the conditions at the time, it was an impressive feat.
From these humble beginnings, the Tour’s average speed gradually increased as a result of several key factors. First and foremost, technological advancements played a significant role. Innovations such as derailleur gears, lighter frames made from aluminium or carbon fibre, aerodynamic clothing, and improvements in nutrition and training regimes all contributed to an upward trend in the peloton’s pace.
Fastest editions of the Tour de France
Among the fastest five editions of the Tour de France, the 2005 edition holds the record, with an astonishing average speed of 41.7 km/h, or approximately 25.9 mph, achieved by Lance Armstrong. However, it’s worth noting that Armstrong was later stripped of his titles due to doping . 2003, 2015, 2017, and 2019 Tours are also among the fastest, with average speeds ranging from 40.7 km/h (25.3 mph) to 40.9 km/h (25.4 mph). 2022’s Tour de France , won by Jonas Vingegaard, saw a new record set with an average speed of 42.03 km/h (26.1mph). That’s now a jump in the Tour de France average mph of 10mph since the inaugural edition in 1903.
Slowest editions of the Tour de France
Contrastingly, the slowest Tours de France typically date back to the early 20th century, primarily due to the aforementioned factors of longer stages, simpler bicycles, and challenging road conditions. The five slowest Tours were the editions from 1919, 1922, 1923, 1924, and 1926, with average speeds ranging from 24.1 km/h (15 mph) to 24.3 km/h (15.1 mph).

How and why the average speed has changed over time
It’s crucial to mention that strategies have also evolved significantly, with modern cycling teams employing more sophisticated tactics, optimising rider roles, and using advanced data analysis to gain an edge. The increased professionalism in the sport has contributed to the upward trend in speed.
Looking forward, it’s exciting to contemplate what could further increase the Tour de France’s average speed. Advancements in bicycle technology continue at a rapid pace, with continuous improvements in weight, aerodynamics, and power transfer. Similarly, cutting-edge training techniques, informed by genetics and sophisticated performance data, will continue to enable cyclists to push the boundaries of human endurance and speed.
Furthermore, improvements in road surfaces, planning of race routes, and even changes in race rules could have an impact. For example, more downhill finishes could raise the overall average speed, although the safety of riders would always be paramount.
In conclusion, the evolution of speed in the Tour de France is a fascinating aspect of this iconic race. From the early Tours, characterised by their gruelling pace and hardy riders, to the high-speed, technology-driven spectacle of today, the race continues to captivate and surprise. As we look to the future, we can expect the boundaries of speed, just like the race itself, to be continuously challenged and redefined.
Related Posts

Training Articles

Tour de France 2019: Individual Time Trial Analysis
Cadence and cornering made all the difference between these two heavy-hitting Time Trial specialists on a technical, hilly individual time trial.
Pau (ITT), 27.2km

- Julian Alaphilippe (Fra) Deceuninck-QuickStep 0:35:00
- Geraint Thomas (GBr) Team Ineos 0:00:14
- Thomas De Gendt (Bel) Lotto Soudal 0:00:36
Stage 13 was the only individual TT of this year’s Tour, and, as expected, was pivotal in clarifying the potential final winner. The course was short and undulating with many twists and turns, and the ultimate victor was the storming Julian Alaphilippe, who excelled on the twisting circuit and short climbs. This was no doubt a route that played to his strengths.

Rider Analysis:
The sole TT of the Tour de France was always going to be a big aim , not just the riders going for the overall classification but also for the TT specialists hoping for a stage result. We are privileged to have three TT powerhouses share their data, to allow us to breakdown their performances.
Joseph Rosskopf (USA) CCC Team is a two-time National TT champion in America (17’ 18’) and has two top 20’s in World Tour TT’s so far in 2019. Alex Dowsett (GBr) Katusha-Alpecin is the current British National TT Champion. He has won this title six times (11’ 12’ 13’ 15’ 16’ 19’) and was a previous world hour record holder. Both riders are extremely experienced in this discipline, and it showed in their results.
Rigoberto Uran is the team leader for EF Education First, and while not known for his Time Trialing, would no doubt have been trying his best to minimize losses on this day. His file came in a little later than the others (things, understandably, get busy at the Tour), so it’s not part of the major analysis, but his rough stats (below) provide good context for the rides of Rosskopf and Dowsett.

Pacing is EVERYTHING
With such variable terrain in the 27km TT it was crucial that riders measure their efforts in specific locations; using precious watts only in areas which would bring the biggest gain was part of every rider’s strategy. Within the first 15km of the stage the riders faced a long climb of 2.3km, another short steep climb of 1km and a 2km drag at 3 percent. This opening half of the ride was crucial; it was during this first half of the ride that both Alex and Joseph put out all their peak powers from 2min to 20min.
Hard Opening Section

Dowsett
Rosskopf .
As the riders went off the start ramp to negotiate the streets of Pau, it is easy to see them keeping their matches for further into the race. Both riders had a very similar power to weight, with only .1w/kg 1 second of difference between them heading into the first climb. Even their starts were similar as they got into the rhythm in the first 10 seconds. Alex averaged 398w, 5.06w/kg and a max of 655w, 9.6w/kg in the first 10sec. Joseph was in a similar effort range as he averaged 543w, 7.43w/kg and a max of 667w, 9.01w/kg.
The most noticeable difference in this first part of the stage is the cadence between both riders ; Joseph consistently pedals over 100rpm, while Alex prefers to grind.
First Long climb- 2.3km@ 5.6%

Rosskopf
It was on this first climb of the stage that we see the first gaps starting to open between these two riders. Joseph put 10 seconds into Alex on this 2.3km climb, spinning a high cadence of 104rpm compared to that of 92rpm of Alex. The slight weight advantage which Joseph has over Alex will have also played a big role on this climb, enabling him to hit 6w/kg for the effort lasting just over 5min long.
Again, the two riders show a similar pacing strategy as they hit the bottom section of the climb with a big effort compared to that of the rest of the climb. Joseph did the first 750m of the climb in 1:57min at 474w, 6.41w/kg and Alex did this same section in 2min at 486w, 6.18w/kg. It was on this steep bottom section of the climb that Alex also produced his peak 2min power for the ride.
Over the top of this first climb was the riders still faced some rolling roads and a steady drag of 1.69km at 3 percent. It was again on the slight uphill that Joseph made the difference compared to that of Alex. On this drag Joseph did 422w, 5.7w/kg for 3:04min at 106rpm, Alex rode this section only 11 seconds slower at a power of 419w, 5.33w/kg at 95rpm.
First Long Downhill, 2.72km -5.5%

The first real downhill after 11.2km would have been a welcome sight to many riders after having used a lot of matches in the opening climbs. But this downhill was technical, with six corners to negotiate at speed. The fastest lines would have been really important to maintain speed using the least possible power. What we can see when comparing the data between Joseph and Alex is that Alex used his downhill and cornering skills to the utmost, which helped him come down the descent slightly faster than Joseph, and using a lot less power to do so.
The speeds taken by Alex into the corners and exiting the corners where generally 5kph faster than Joseph, which meant Joseph had to make some big spikes in power to get back up to speed. Also, on the straights between the corners we can see that Alex keep the pressure on the pedals slightly more, which enabled him to maintain a high speed and hit the corners slightly ‘hotter’ compared to Joseph.
Route de Nay climb 1km@ 7%
(This is where Dowsett lost most time to Rosskopf)
There was a nasty surprise awaiting the riders as they finished the fast descent; a 1km climb at 7 percent. Joseph was to use his lighter frame and high cadence to really power on this hill, and got up it 17sec quicker than Alex. Again, the impressive high cadence by Joseph of 106rpm on the 7 percent grade shows his ability to produce a high power in the saddle a low torque; a fantastic attribute to any TT rider wanting to excel on the rolling circuits. It was on the climb that Joseph produced his peak 2min power for the day.
Gau to Pau – 5.58km
In what was really the only long flat straight of the course where a consistent power could be put down was in the run into the finish as the riders hit with just over 9km to the finish. It was at this location the more powerful riders will have been able to make up any deficient on the smaller punchier type riders who may have had an advantage up to this point. Alex probably felt at home on this section as he was able to use his big engine to complete this part of the course in just over 6min and taking 4sec out of Joseph over the 5.58km. Again, we see on this section that Joseph still maintained his high cadence of 107rpm as he kept a steady effort at 402w. The riders where now on the home straight as they entered the outskirts of the city of Pau to tackle the last obstacle of the stage.
Dowsett
The final kilometer was dominated by the steep section of road, which riders hit with just 450m left to go. On the steepest section the riders faced 16 pecent for 80m, which would have been a terribly painful way to finish a TT, especially after having been in the hurt box for over 35min. On this steep section of road both the riders put out a massive effort, producing their best 10, 12, 20 and 30sec efforts on this steep berg. Joseph went up this 16 percent section in 17sec at 661w, 8.93w/kg and Alex power up in 19sec at 693w, 8.82w/kg. Again, it was on the climb that Joseph was to make the biggest difference to Alex within the last kilometer of racing.
In what was one of the most exciting Time Trials in recent years, stage 13 of the Tour De France proved to be a demanding course and one that required expert pacing and using your best characteristics at the right times in order to get the most out of stage. Thanks to all three of these riders for sharing their data.

Ultimate Century Training Guide
Training Guide
This guide is designed to be used as you train for a century, with in-depth information on every part of the process. Each chapter is packed with tips, workouts, and insights from expert cycling coaches, to give you all the tools you need to succeed.
Dig Deep Coaching is a global coaching company that works with athletes of all levels across the following disciplines: road, track, cyclocross, MTB and triathlon. Whether you are taking part in your first ever gran fondo or aiming to compete in the professional peloton, Dig Deep Coaching can help you out. Get in touch via email or follow Dig Deep Coaching at Facebook Twitter and Instagram Sign up to our Mailing list and get 3 FREE crucial Sportive workouts and much more Training and Racing information. Register HERE
Unlock Your Athletic Potential
Get tips, resources and inspiration for your journey to Peak Performances sent directly to your inbox weekly.

2-FOR-1 GA TICKETS WITH OUTSIDE+
Don’t miss Thundercat, Fleet Foxes, and more at the Outside Festival.
GET TICKETS
BEST WEEK EVER
Try out unlimited access with 7 days of Outside+ for free.
Start Your Free Trial
Powered by Outside
Tour de France
The power numbers at this year’s tour de france are the highest in the modern era of cycling, in this column, we dive into the power numbers of the world’s best riders at the tour de france..
Heading out the door? Read this article on the new Outside+ app available now on iOS devices for members! >","name":"in-content-cta","type":"link"}}'>Download the app .
We are only nine stages into the Tour de France, and five mountainous stages have already blown the GC to shreds. After countless attacks, breakaways, satellite riders, bonus seconds, and mountain top finishes, only 17 seconds separate Jonas Vingegaard and Tadej Pogačar in the fight for the yellow jersey.
Read also: Power Analysis: Tour de France – Pogačar, Vingegaard, and Victor Lafay
Two of those stages flipped the original script, which saw 2022 Tour de France winner Vingegaard take over a minute on Pogačar on stage 5 to Laruns. We are in for a show in the next two weeks of racing, which includes the Grand Colombier, Col de Joux Plane, and Col de la Loze.
The power numbers from this year’s Tour de France are the highest in the modern era of cycling. 7w/kg for 20 minutes is the new standard for GC contenders, and many of these performances come after 3500 kJs of work, at 1000-2000 meters above sea level, and in 30+°C (86+°F) temperatures.
Unlike 2022, Vingegaard didn’t wait long to play his cards and attack Pogačar. Stage 5 from Pau to Laruns included the Col du Soudet (15.2km at 7%), Col d’Ichere (4.2km at 6.2%), and the Col de Marie Blanque (7.8km at 8.4%) whose final 4.8km average 10.5%.
A massive breakaway stayed away for the stage win while Jumbo-Visma laid the battleground for Vingegaard. When the Dane launched off Sepp Kuss’ wheel, Pogačar didn’t even respond. Vingegaard did one of the best climbing performances of his career on the steepest slopes of the Col de Marie Blanque, pushing nearly 7w/kg for over 20 minutes. The reigning Tour Champion continued pushing over the top of the climb to the finish line in Laruns where he took one minute and four seconds on Pogačar.
While we don’t have Vingegaard’s power data, we can make an educated guess based on other riders’ power data and times on the Col de Marie Blanque. In 2020, a 21-year-old Pogačar climbed the Col de Marie Blanque over a minute and a half slower than Vingegaard’s 2023 time, but still won stage 9 of the 2020 Tour ahead of Primož Roglič and Marc Hirschi.

Pogačar – Col de Marie Blanque in the 2020 Tour de France Time: 24:28 Average Power: 428w (6.4w/kg) Final 2.5km: 9:23 at 458w (6.9w/kg)
Vingegaard (2023): 22’ 56” at ~6.9w/kg
Many wrote off the 2023 Tour after Vingegaard’s stage 5 performance, citing Pogačar’s ongoing wrist recovery as the reason for his subpar performance. But the Slovenian struck back less than 24 hours later on the Cauterets-Cambasque (final 5.3km at 7.5%).
Before Pogačar’s winning attack, Jumbo-Visma had blown the race apart 40km earlier on the Col du Tourmalet (17km at 7.4%). Long, high-altitude climbs are typically Pogačar’s weakness, and Jumbo-Visma thought they might be able to crack the Slovenian for the second day in a row.
Vingegaard launched off of Kuss’ wheel again with 4.7km to the top of the Tourmalet, but Pogačar stayed glued to his wheel. Both riders did ~6.8w/kg for over 13 minutes, but neither rider cracked on the legendary climb. The final 4.8km of the Tourmalet climbs from 1700m to 2100m, so these power numbers are even more impressive when you consider the high altitude.
The closest rider to Vingegaard and Pogačar with power data was Steff Cras, who pushed nearly 6w/kg for 15 minutes but still lost two minutes to the leading pair.
![[Image – Pogačar – Final 4.7km of the Tourmalet]](https://velo-cdn.outsideonline.com/wp-content/uploads/2023/07/Pogacar-final-4.7km-of-the-Col-du-Tourmalet-720x647.jpg?width=720 "average cadence tour de france")
Pogačar – Final 4.7km of the Tourmalet Time: 13:19 Estimated Average Power: ~449w (6.8w/kg)
Steff Cras: 15’ 19” at 360w (5.6w/kg)
After a long descent and rolling uphill, the final slopes of the Cote de Cauterets began. Vingegaard attacked on the 10% section of the climb and continued to pace with Pogačar in his wheel. But to almost everyone’s surprise, Pogačar attacked and dropped Vingegaard, soaring to the stage win and taking 28 seconds back on the defending Tour champion.
This result was shocking because Vingegaard clearly wasn’t at his best when you look at the power data. Pogačar did roughly 6.7w/kg for 13 minutes on the Cote de Cauterets, while Vingegaard only managed 6.6w/kg.
Michał Kwiatkowski had been caught from the breakaway, and he was the only rider who could stay in the wheels of Vingegaard and Pogačar for the first part of the Cote de Cauterets. The former world champion was pushing 6.5w/kg in the draft before finally succumbing to the ferocious pace.
![[Image – Kwiatkowski – Cote de Cauterets]](https://velo-cdn.outsideonline.com/wp-content/uploads/2023/07/Kwiato-Cote-de-Cauterets-720x739.jpg?width=720 "average cadence tour de france")
Kwiatkowski – Cote de Cauterets Time: 16:22 Average Power: 342w (5.2w/kg) First 1.3km with Vingegaard and Pogačar: 4’ at 430w (6.5w/kg)
Pogačar : 13:00 at ~6.7w/kg Vingegaard: 13:24 at ~6.6w/kg
Just 24 hours previous, Vingegaard pushed ~6.9w/kg for nearly 23 minutes on the Col de Marie Blanque. Thus, the Cote de Cauterets was a disappointing performance. This could be a sign of Vingegaard’s inconsistency. Or perhaps he peaked too early in this year’s Tour de France. The next 12 stages will reveal the answer.
The last test before the Tour’s first rest day was the Puy du Dôme (final 4.5km at 11.5%), a ridiculously steep climb to the top of a dormant volcano outside Clermont-Ferrand. Mike Woods won the stage from the breakaway after overcoming a 2-minute deficit to Matteo Jorgenson in the final 4km. The Canadian pushed nearly 6w/kg for 15 minutes after more than 3800 kJs of work in the break.
14 minutes later, the GC group hit the steepest slopes of the Puy du Dôme, and Jumbo-Visma lined it out for the yellow jersey wearer, Vingegaard. However, neither Vingegaard nor Pogačar seemed confident in their legs when the pace slowed after Sepp Kuss’ final pull. Pogačar waited until 1.3km to go to launch his attack, going out of the saddle for nearly 30 seconds and gapping Vingegaard.
The Dane stayed strong, and Pogačar’s gap didn’t waver until the final 200 meters. Vingegaard only ceded eight seconds to Pogačar by the line, which meant that he took a 17-second GC lead into the Tour’s first rest day.
Woods was two minutes and five seconds slower than Pogačar in the final 4.5km of the Puy du Dôme, despite pushing nearly 6w/kg.
![[Image – Woods – Puy du Dôme (final 4.3km)]](https://velo-cdn.outsideonline.com/wp-content/uploads/2023/07/Woods-Puy-du-Dome-final-4.5km-720x686.jpg?width=720 "average cadence tour de france")
Woods – Puy du Dôme (final 4.3km) Time: 16:51 Average Power: 369w (5.9w/kg)
Pogačar: 14:46 at ~6.9w/kg Vingegaard : 14:54 at ~6.8w/kg
After the first nine stages of the Tour, a handful of bonus seconds and meters separates Jonas Vingegaard and Tadej Pogačar. Most of the mountain stages have been won and lost in 15-20 minute performances, and Vingegaard’s effort up the Col de Marie Blanque remains the biggest outlier (22’ 56” at ~6.9w/kg).
We know that Vingegaard and Pogačar can do 6.9w/kg for 15 minutes at the end of a five-hour Tour de France stage. But can they do it stage after stage, week after week, for 12 more days? Heat and high altitude have a history of causing cracks in Pogačar, whereas Vingegaard has already shown a bit of inconsistency on consecutive mountain stages. The 2023 Tour de France Champion is anyone’s guess.
*** Power Analysis data courtesy of Strava
Strava sauce extension
Tadej Pogačar
Michał Kwiatkowski
Popular on Velo
What’s it like to be an American cyclist living in France? Watch to get professional road cyclist Joe Dombrowski’s view.
Related content from the Outside Network
One way south, mountain bikers react to their first taste of non-alcoholic craft beer, video review: bmc urs 01 two gravel bike, kiel reijnen vuelta video diary: the painful decision to abandon.
Tour of Turkey
Tour de romandie, uci bmx racing world cup tulsa, athens orthopedic clinic twilight crit, la vuelta españa femenina, curiosity lab criterium, spin the district: union city, eschborn-frankfurt, spin the district: hapeville, giro d'italia, gp morbihan (coupe de france), lagrange cycling classic, tro bro leon (coupe de france), uci mtb fort william, spin the district: college park, how does your average bike speed compare with tour de france pros, how does your average bike speed stack up with the fastest riders in the world.

The Tour de France is the pinnacle when it comes to cycling competitions. It is one of the most-watched sporting events in the world and showcases some of the fittest athletes on the planet. The pure athleticism that is on display during this 21-day, 2,200-mile race is inspiring, enlivening, and these cyclists seem somewhat superhuman.
You might be asking yourself, “So how fast are they even going?” Or, “How do I compare to these athletes?” Luckily for you, with today’s technology, various metrics can be tracked during these cycling competitions, so everyone can compare their statistics to those of the pros. As with any metric, the speeds at which the Tour de France pros cycle will vary, but there are averages that have been tracked for decades now.
Here are a few of the average speeds for the professional cyclists that race in the Tour de France:
Average Speed on Flat Ground: 25-28 mph
The average speed for professional cyclists while traversing on flat terrain is 25-28 mph. The average amateur cyclist travels about 17-18 mph while on flat ground. For many pro athletes racing in the Tour de France, being able to maintain a fast speed on flat terrain allows them to simply stay competitive with the other athletes. It is in the climbing portions of the Tour de France that the best gain separation from the peloton.
Average Cobblestone Speed: 22-24 mph
In every Tour de France, there is at least one section of cobblestone that the cyclists must ride through -- sometimes, though, this is replaced with a stretch of gravel pavement. The small grooves in the road and uneven terrain can be difficult to tread, but these athletes still average an impressive 22-24 mph.
Average Speed Climbing: 12.8 mph
In the 2019 Tour de France, the athletes averaged 12.8 mph while trudging through the infamous climbs of the race. These athletes are literally cycling up and through the Pyrenees and Alps during this phase of the Tour de France, making for some of the most memorable moments of the Tour.
Fastest Recorded Speed: 63.1 mph
The fastest recorded speed of the Tour de France came from German Nils Politt while descending Col de Vars during stage 18 of the race. This was the second of four climbs in the stage, and Politt was the first-ever rider to break the 100 km/hr barrier by traveling at a speed of 101.5 km.hr on this descent.
Jonas Vingegaard Tour de France 2022 | Average Speed: 26.11
Jonas Vingegaard won his first Tour de France in 2022 on his second time participating in the tour. He spent the majority of the race trading leads back and forth with fan-favorite, Tadej Podacar. Vangegaard pushed through stage 19 and crossed the finish line 2 minutes and 43-second ahead of Podačar. After a total of 79 hours, 33 minutes, and 20 seconds on the bike, Jonas Vangegaard became the first Danish Tour de France champion since 1996
Tadej Pogačar Tour de France 2021 | Average Speed: 25.5 mph
Tadej Podačar was only 22 years old when he earned his second consecutive win at the Tour de France. Podačar made the victory look easy when he also earned a polka-dot jersey for top climber and white jersey for best young cyclist. His quick rise to first place had people consider him one of the most exceptional young cyclists the Tour de France had seen in years. He finished the race in 82 hours, 56 minutes and 36 seconds.
Tadej Pogačar Tour de France 2020 | Average Speed: 24.77
Tadej Podačar for UAE Team Emirates shocked fans at his 2020 Tour de France debut. At 21 years old he managed to break all expectations and snatch a victory from Primoz Roglic, who was expected to cruise to a first-place finish. In the final stage of the tour, Podačar sped through a 57-second deficit and earned his first yellow jersey, becoming the youngest Tour de France Winner in 111 years.
Egan Bernal Tour de France 2019 | Average Speed: 25.2 mph
The 2019 Tour de France winner, Egan Bernal of Colombia, averaged 25.2 mph. He is the first Latin American to ever win the Tour de France. At age 22, he is also the youngest Tour de France winner in modern racing history. He finished the 2,091.4 mile race in exactly 82 hours and 57 minutes.
While not every cyclist has aspirations of ever racing in the Tour de France, having these metrics is a fun way for everyday cyclists to compare themselves to the superhuman riders that conquer the most famous cycling race in the world.
- Feature Story
Related Content

Apr 27, 2024

Apr 26, 2024

Subscribe to my YouTube channel for video reviews.
Tour de France Statistics You Probably Never Heard About (2023 TdF Included)
Tour de France’s rich history goes back to 1903, when its first edition took place. Nowadays, it is the most famous cycling race globally. One day, I asked myself:
What will I discover if I visualize the data collected from over 100 editions?
The result is a unique set of charts and facts about the Tour de France that can provide valuable insights. And maybe, we can also better predict the future winners.
Learn more about the total distance, average stage length, rider’s height, weight, BMI, and other interesting data, and how they developed.
Let’s dive into one of the biggest sets of the Tour de France statistics.
Abbreviations used: GC – General Classification, GT – Grand Tour, TdF – Tour de France, BMI – Body Mass Index
I used publicly available data from wikipedia.org , procyclingstats.com , and the official Tour de France website letour.fr as data sources. Some data is not available (especially the rider’s weights/heights).
Please also keep in mind the following:
- The Tour de France did not take place between 1915-1918 and 1940-1946.
- Lance Armstrong was stripped of all his results and prizes from 1 August 1998; no alternative winners of TdF 1999-2005 have yet been declared.
- The actual rider’s racing weight could vary.
Tour de France 2023 Summary
The overall winner of the 2023 Tour de France is Jonas Vingegaard (DK). He finished 7:29 ahead of Tadej Pogačar . Vingegaard covered the 3,401 km route, averaging 41.43 km/h.
The 2023 Tour de France points classification winner is Jasper Philipsen (BE). He accumulated 377 points and won 4 stages (stage 3, stage 4, stage 7, and stage 11).
The 2023 Tour de France mountain classification winner is Giulio Ciccone (IT). He accumulated 106 points.
The best young rider (under 25 years) for the 2023 Tour de France is Tadej Pogačar (SLO). He finished 7:29 behind Jonas Vingegaard.
Tour de France Total Distance
The Tour de France was the longest Grand Tour for decades. The first 3 editions were relatively short (2,428, 2,428, and 2,994 km). However, that changed with the 4th edition. For the next decades, riders had to cover an overall distance exceeding 5,000 km. Luckily for riders, this distance shortened over time.
The average Tour de France length of all editions is 4,190 km . The average length was 4,139 km between 1960 and 1980, 3,791 km between 1980 and 2000, and “only” 3,491 km between 2000 and 2020. The total length of the 2023 Tour de France is 3401.3 km .

Tour de France Average Speed
The average Tour de France speed of all editions is 34.62 km/h . The average speed was 27.67 km/h between 1919 and 1939, and 40.15 km/h between 1999 and 2019. The average speed of the 2023 Tour de France was 41.43 km/h .

The average speed improved mainly thanks to technological progress, better training methods, and nutrition specialists
Do you think we will ever see a Tour de France ridden with an average speed exceeding 45 km/h?
Number and Length of the Tour de France Stages
The number of Tour de France stages increased from 6-15 stages to more than 20, depending on the edition. For the last few years, it has remained the same (21).
The average Tour de France stage length of all editions is 218 km (time trials included). It went down from a whopping 286 km between 1909-1939 to 197 km between 1949-1979 and 173 km between 1989-2019. The average stage length of the 2023 Tour de France is 162 km .

Historical Extremes of the Tour de France
Can you guess the longest and shortest Tour de France edition ?
The longest Tour de France took place in 1926. Riders had to cover 5,745 km (this is about the same distance as from New York to London).
The shortest Tour de France were the first two editions (1903 and 1904); they had the same length of 2,428 km .
The longest Tour de France stage was the 5th stage of the 1919 edition; it was 482 km long.
The fastest Tour de France took place in 2022. The average speed of the winner was 41.84 km/h.
The slowest Tour de France was the 22nd edition (1924). The winner, Ottavio Bottecchia, reached a winning time of 226h 18′ 21″ on an overall distance of 5,425 km. This results in an average speed of 23.97 km/h .
IMPORTANT NOTE : Many websites (including Wikipedia) list the 1919 Tour de France as the slowest TdF ever (24.06 km/h). This claim is incorrect because the 1924 Tour de France was even slower (23.97 km/h).
Interested in more statistics? I summarized Giro and Vuelta as well.
Tour de France Rider’s Height, Weight, and BMI (Over Time)
How do the Tour de France riders’ height, weight, and BMI develop over time? How do these data differ between riders for the general classification, climbers, and sprinters (all-rounders)? You learn in this section.
NOTE : The heights and weight data are unfortunately not available for all riders.
General Classification
Tour de France winners are getting taller but leaner. ..
A friend once told me I am too tall for cycling (I am 1.85 m). I thought he was right, but he was not. Even tall riders like Bradley Wiggins (1.90 m), Chris Froome (1.86 m), or Miguel Indurain (1.86 m) have won the Tour de France. And it seems that the Tour de France is being won by taller and taller riders (check the chart below).
The average height of a Tour de France winner is 1.77 m .
The tallest Tour de France winner ever was Bradley Wiggins (TdF 2012). He is 1.90 m tall.
The shortest Tour de France winner ever was Romain Maes (TdF 1935). He was 1.60 m tall.

Lower weight = Better Chance to Win Tour de France?
The average weight of a Tour de France winner is 68.1 kg .
The heaviest Tour de France winner was François Faber. He won the 1909 TdF, weighing 88 kg .
The lightest Tour de France winner was Marco Pantani. He won the 1998 TdF, weighing just 57 kg .

Of all the charts in this article, I like the BMI chart the most because it shows an interesting trend. Let’s quickly repeat what BMI means.
BMI uses your height and weight to work out if your weight is healthy. ( Source )
Here is a quick guide on how to interpret these values:
- Below 18.5 – underweight,
- 18.5-24.9 – normal,
- 25.0-29.9 – overweight,
- 30.0 and above – obese.
With this know-how, we get a better understanding of these values.
Tour de France winners have an average BMI of 21.70 .
The Tour de France winner with the highest BMI was François Faber. He won the 1909 Tour de France with a BMI of 27.77 (1.78 m, 88 kg). Yes, the Faber won TdF while being overweight.
The Tour de France winner with the lowest BMI was Chris Froome. He won the TdF in 2013, 2015, 2016, and 2017 with a BMI of 19.08 (1.86 m, 66 kg).

Do you want to know how do you compare with pro riders? Feel free to calculate your BMI using the calculator below.
BMI CALCULATOR
Mountain Classification
The average height of a Tour de France mountain classification winner is 1.75 m .
The tallest Tour de France mountain classification winner ever is Mauricio Soler (TdF 2007). He is 1.90 m tall.
The shortest Tour de France mountain classification winner ever was Julián Berrendero (TdF 1936). He was 1.62 m tall.

The average weight of a Tour de France mountain classification winner is 64.4 kg .
The heaviest Tour de France mountain classification winners were Louison Bobet (TdF 1950) and Santiago Botero (TdF 2000). They won the mountain classification, weighing 75 kg .
The lightest Tour de France mountain classification winner was Luis Herra. He won the 1985 and 1987 TdF mountain classifications, weighing just 57 kg .

Tour de France mountain classification winners have an average BMI of 21.14 .
The Tour de France mountain classification winner with the highest BMI was Sylvère Maes. He won the 1939 Tour de France mountains classification with a BMI of 24.80 (1.68 m, 70 kg).
The Tour de France mountain classification winner with the lowest BMI was Warren Barguil. He won the 2017 Tour de France mountains classification with a BMI of 18.42 (1.82 m, 61 kg). This means he was underweight.

You might also be interested How much does a Tour de France bike cost? How much does a Tour de France bike weigh?
Points Classification
The average height of a Tour de France points classification winner is 1.78 m .
The tallest Tour de France points classification winner s ever were Tom Boonen (TdF 2007) and Wout van Aert (2022). They are 1.90 m tall.
The shortest Tour de France points classification winner ever was Stan Ockers (TdF 1955, 1956). He was 1.65 m tall.

The average weight of a Tour de France points classification winner is 72.5 kg .
The heaviest Tour de France points classification winner was Tom Boonen. He won the 2007 TdF points classification, weighing 82 kg .
The lightest Tour de France points classification winner was Stan Ockers. He won the 1955 and 1956 TdF points classification, weighing just 61 kg .

A Tour de France points classification winner has an average BMI of 22.88 .
The Tour de France points classification winner with the highest BMI was Walter Godefroot (1.71 m, 73 kg). He won the 1970 Tour de France points classification with a BMI of 24.96 .
The Tour de France points classification winner with the lowest BMI was Bernard Hinault (1.74 m, 62 kg). He won the TdF 1979 points classification with a BMI of 20.48 .

TIP : Don’t you have a bike yet? Feel free to browse my selection of the best bikes on the market.
Overall Victories, Stage Wins, Days in Yellow…
The riders with the most Tour de France GC wins (5) are Eddy Merckx, Bernard Hinault, Jacques Anquetil, and Miguel Indurain. Chris Froome is the closest active rider to these legends with his 4 TdF wins.

Eddy Merckx also dominated another statistic as he is the rider with the most days spent in the yellow jersey * (Maillot Jaune).
*Including half-stages.

The following table shows the three riders with the most Tour de France stage wins .
Who is the rider with the most Tour de France participation ? Sylvain Chavanel . The 2nd place belongs to George Hincapie, Stuart O’Grady, Jens Voigt, and the 3rd to Joop Zoetemelk and Haimar Zubeldia.
Riders with the Most Mountain & Points Classification Victories
The best climber , according to the number of Mountain Classification victories, was Richard Virenque. He won this classification seven times .
According to the number of Points Classification victories, the best sprinter is the Slovak Peter Sagan , who has won 7 times .
If you are into cycling and numbers, make sure you also read these Incredible Bicycle Statistics .
I hope you enjoyed these Tour de France statistics as I did when putting them together. What is your favorite stat? Let me know in the comments section.
Be sure also to check my Cycling Grand Tours Statistics , where I compare all Grand Tours, or continue reading:
Tour de France Statistics FAQ
Not yet. However, Eddy Merckx was closest to this in 1969. He won the yellow jersey, polka dot jersey, and green jersey. The young rider classification was introduced in 1975. Only riders below 26 years of age are eligible. Eddy Merckx was 24 years old in 1969. This means he would have won all 4 jerseys in the same Tour de France edition.
Eddy Merckx is considered “the greatest” Tour de France rider and “the greatest” cyclist of all time. He won 11 grand tours (5 times Tour de France, 5 times Giro d’Italia, and once Vuelta a España). He won 3 TdF points classifications, 2 mountains classification, and 4 combativity awards. Together with Mark Cavendish, he also holds a record for the most stage wins (34).
This scenario happened only twice (in 1947 and 1968) and will likely not happen again. It is a tradition that riders don’t compete for GC in the final stage.
This scenario happened four times (in 1903, 1924, 1928, and 1935). With the tough competition nowadays, it is likely never to happen again.
wikipedia.org procyclingstats.com letour.fr lequipe.fr The preview picture ©A.S.O./Charly Lopez (cropped)
Browse Other Cycling Statistics
General Stats Bicycle Statistics & Facts Best Bicycle Brands Road Bike Prices & Weights Statistics Road Bike Wheels Weights Statistics How Much Does a Tour de France Bike Cost?
Grand Tours Cycling Grand Tours Statistics (Compared) Tour de France Statistics Giro d’Italia Statistics Vuelta a España Statistics
Cycling Monuments Cycling Monuments (Compared) Milan–San Remo Statistics Tour of Flanders Statistics Paris–Roubaix Statistics Liège-Bastogne-Liège Statistics Giro di Lombardia Statistics
About The Author
Petr Minarik
4 thoughts on “tour de france statistics you probably never heard about (2023 tdf included)”.
I just like the helpful information you provide in your articles.
Thank you. 🙂 – Petr
Impressive stats! That must have been a lot of work.
It sure was! – Petr
Leave a Comment Cancel Reply
Your email address will not be published. Required fields are marked *
Save my name, email, and website in this browser for the next time I comment.
Start typing and press enter to search
- Tour de France
- Giro d'Italia
- La Vuelta ciclista a España
- World Championships
- Milano-Sanremo
- Amstel Gold Race
- Tirreno-Adriatico
- Liège-Bastogne-Liège
- Il Lombardia
- La Flèche Wallonne
- Paris - Nice
- Paris-Roubaix
- Volta Ciclista a Catalunya
- Critérium du Dauphiné
- Tour des Flandres
- Gent-Wevelgem in Flanders Fields
- Clásica Ciclista San Sebastián
- UAE Team Emirates
- Arkéa - B&B Hotels
- Astana Qazaqstan Team
- Alpecin-Deceuninck
- Bahrain - Victorious
- BORA - hansgrohe
- Decathlon AG2R La Mondiale Team
- EF Education-EasyPost
- Groupama - FDJ
- INEOS Grenadiers
- Intermarché - Wanty
- Lidl - Trek
- Movistar Team
- Soudal - Quick Step
- Team dsm-firmenich PostNL
- Team Jayco AlUla
- Team Visma | Lease a Bike
- Grand tours
- Top competitors
- Final GC favorites
- Stage profiles
- Riders form
- Countdown to 3 billion pageviews
- Favorite500
- Profile Score
- Stage 21 Results
- Startlist quality
- All stage profiles
- Hardest stages
- Winners and leaders
- Prizemoney ranking
- Fastest stages
- Statistics - Statistics
- Startlist - Startlist
- More - More
- Teams - Teams
- Nations - Nations
- Route - Route
- Results - Results
- »
- Average speed per stage
Follow-up links
- Fastest editions
- Most constant rider
- Smallest sum of results
- Most bonifications
- Hottest stages
- Leader jerseys
- Best worse result
- Combative riders
- Fastest first and last hour
- Timegap chart
- GC without TTs
- GC Without 1 stage
- GC without time bonusses
- Most GC time changes
- Points GC breakdown
- Least predictable
Grand Tours
- Vuelta a España
Major Tours
- Volta a Catalunya
- Tour de Romandie
- Tour de Suisse
- Itzulia Basque Country
- Milano-SanRemo
- Ronde van Vlaanderen
Championships
- European championships
Top classics
- Omloop Het Nieuwsblad
- Strade Bianche
- Gent-Wevelgem
- Dwars door vlaanderen
- Eschborn-Frankfurt
- San Sebastian
- Bretagne Classic
- GP Montréal
Popular riders
- Tadej Pogačar
- Wout van Aert
- Remco Evenepoel
- Jonas Vingegaard
- Mathieu van der Poel
- Mads Pedersen
- Primoz Roglic
- Demi Vollering
- Lotte Kopecky
- Katarzyna Niewiadoma
- PCS ranking
- UCI World Ranking
- Points per age
- Latest injuries
- Youngest riders
- Grand tour statistics
- Monument classics
- Latest transfers
- Favorite 500
- Points scales
- Profile scores
- Reset password
- Cookie consent
About ProCyclingStats
- Cookie policy
- Contributions
- Pageload 0.1838s
- Sports & Recreation ›
Professional Sports
Industry-specific and extensively researched technical data (partially from exclusive partnerships). A paid subscription is required for full access.
- Winner average speed in the Tour de France 1903-2023
Tour de France winner's average speed from 1903 to 2023 (in kilometers per hour)
- Immediate access to 1m+ statistics
- Incl. source references
- Download as PNG, PDF, XLS, PPT
Additional Information
Show sources information Show publisher information Use Ask Statista Research Service
September 2023
1903 to 2023
All figures have been rounded.
Other statistics on the topic Tour de France
Sports & Fitness
- Tour de France riders with the most victories 1903-2022
- Budget of selected Tour de France teams 2023
- Tour de France riders with the most stage wins 1903-2023
- Most Tour de France wins 1903-2022, by country
To download this statistic in XLS format you need a Statista Account
To download this statistic in PNG format you need a Statista Account
To download this statistic in PDF format you need a Statista Account
To download this statistic in PPT format you need a Statista Account
As a Premium user you get access to the detailed source references and background information about this statistic.
As a Premium user you get access to background information and details about the release of this statistic.
As soon as this statistic is updated, you will immediately be notified via e-mail.
… to incorporate the statistic into your presentation at any time.
You need at least a Starter Account to use this feature.
- Immediate access to statistics, forecasts & reports
- Usage and publication rights
- Download in various formats
You only have access to basic statistics. This statistic is not included in your account.
- Instant access to 1m statistics
- Download in XLS, PDF & PNG format
- Detailed references
Business Solutions including all features.
Statistics on " Tour de France "
- Tour de France winners 1903-2021, by podium position
- Tour de France entrants and finishers 1903-2023
- Tour de France 2021: general riders ranking, by times
- Tour de France 2021 : general teams ranking, by times
- Tour de France 2021: best sprinters, by number of points
- Tour de France 2021: Best climbers, by number of points
- Salaries of the highest-paid Tour de France riders 2021
- Tour de France performance bonuses 2021
- Riders with the most Tour de France yellow jerseys 1903-2023
- Riders with the most Tour de France entries 1903-2023
- Tour de France best-performing countries 1903-2021, by podium position
- Tour de France total French TV audience 2022-2023
- TV channels broadcasting Tour de France 2021
- Tour de France live broadcasters 2021, by geographical area
- Tour de France sponsor partners 2021, by type
- Tour de France revenue distribution 2019
- Interest in watching Tour de France 2020 and 2021, by country
- Share of the French population intending to follow the Tour de France 2021
- Influencing factors for watching Tour de France 2021, by nation
- Deterrents for not watching Tour de France 2021, by nation
- Sports with the most anti-doping rule violations worldwide 2020
- Tour de France riders who committed anti-doping violations 1968-2023
- Confidence in Tour de France teams for complying with the anti-doping rules 2023
Other statistics that may interest you Tour de France
Event history
- Premium Statistic Tour de France winners 1903-2021, by podium position
- Premium Statistic Tour de France entrants and finishers 1903-2023
- Basic Statistic Most Tour de France wins 1903-2022, by country
- Premium Statistic Winner average speed in the Tour de France 1903-2023
2021 edition
- Premium Statistic Tour de France 2021: general riders ranking, by times
- Premium Statistic Tour de France 2021 : general teams ranking, by times
- Premium Statistic Tour de France 2021: best sprinters, by number of points
- Premium Statistic Tour de France 2021: Best climbers, by number of points
- Premium Statistic Salaries of the highest-paid Tour de France riders 2021
- Premium Statistic Budget of selected Tour de France teams 2023
- Premium Statistic Tour de France performance bonuses 2021
- Basic Statistic Tour de France riders with the most victories 1903-2022
- Basic Statistic Riders with the most Tour de France yellow jerseys 1903-2023
- Basic Statistic Tour de France riders with the most stage wins 1903-2023
- Premium Statistic Riders with the most Tour de France entries 1903-2023
- Premium Statistic Tour de France best-performing countries 1903-2021, by podium position
TV audience and sponsorship
- Premium Statistic Tour de France total French TV audience 2022-2023
- Premium Statistic TV channels broadcasting Tour de France 2021
- Premium Statistic Tour de France live broadcasters 2021, by geographical area
- Premium Statistic Tour de France sponsor partners 2021, by type
- Premium Statistic Tour de France revenue distribution 2019
Fan interest
- Premium Statistic Interest in watching Tour de France 2020 and 2021, by country
- Premium Statistic Share of the French population intending to follow the Tour de France 2021
- Premium Statistic Influencing factors for watching Tour de France 2021, by nation
- Premium Statistic Deterrents for not watching Tour de France 2021, by nation
Anti-doping rule violations
- Premium Statistic Sports with the most anti-doping rule violations worldwide 2020
- Premium Statistic Tour de France riders who committed anti-doping violations 1968-2023
- Premium Statistic Confidence in Tour de France teams for complying with the anti-doping rules 2023
Further related statistics
- Premium Statistic Opinion of cycling fans in France on the future winner of the Tour de France 2017
- Premium Statistic Tour de France presumed winners in France 2021
- Basic Statistic Tour de France: the French's favorite national cyclists in 2016
- Basic Statistic French cyclists who marked the Tour de France according to cycling enthusiasts 2017
- Basic Statistic Opinion of French tennis fans on the future winner of Roland Garros 2017
- Basic Statistic Tour de France: Spanish winners 1903-2023
- Premium Statistic Public interest in Tour de France among French 2018
- Basic Statistic Number of cyclists wearing the Tour de France Yellow Jersey 1919-2019, by country
- Basic Statistic Average vehicle speed on motorways in the United Kingdom (UK), 2014
- Basic Statistic "Best Actress" winners at the Tony Awards 1982-2015, by ethnicity
- Premium Statistic Average connection speed from Q1 2014 to Q1 2017 in Finland
- Premium Statistic Average connection speed from Q1 2014 to Q1 2017 in Switzerland
- Premium Statistic Average internet connection speed in Indonesia Q1 2014-Q1 2017
- Premium Statistic Number of victories of members of Spanish film industry at the Oscars 1969-2020
- Premium Statistic Share of French wishing to follow the 2017 Tour de France
- Premium Statistic Generation Z preferred work model in Poland 2020
- Premium Statistic Repair of household appliances, garden equipment revenue in Luxembourg 2010-2022
Further Content: You might find this interesting as well
- Opinion of cycling fans in France on the future winner of the Tour de France 2017
- Tour de France presumed winners in France 2021
- Tour de France: the French's favorite national cyclists in 2016
- French cyclists who marked the Tour de France according to cycling enthusiasts 2017
- Opinion of French tennis fans on the future winner of Roland Garros 2017
- Tour de France: Spanish winners 1903-2023
- Public interest in Tour de France among French 2018
- Number of cyclists wearing the Tour de France Yellow Jersey 1919-2019, by country
- Average vehicle speed on motorways in the United Kingdom (UK), 2014
- "Best Actress" winners at the Tony Awards 1982-2015, by ethnicity
- Average connection speed from Q1 2014 to Q1 2017 in Finland
- Average connection speed from Q1 2014 to Q1 2017 in Switzerland
- Average internet connection speed in Indonesia Q1 2014-Q1 2017
- Number of victories of members of Spanish film industry at the Oscars 1969-2020
- Share of French wishing to follow the 2017 Tour de France
- Generation Z preferred work model in Poland 2020
- Repair of household appliances, garden equipment revenue in Luxembourg 2010-2022
IMAGES
VIDEO
COMMENTS
Remco Evenepoel goes on first outdoor ride since horror crash, hints at Tour de France on Strava 'On my way back' says the Belgian, as he builds back up to Tour de France form with almost-100km ride
There's nothing quite like celebrating 'Merica, pounding hot dogs, and enjoying three weeks of the Tour de France. July is the real "most wonderful time of the year" during which the greatest bike racers on the planet battle over the most storied tarmac in our sport.For nearly 100 years the discussion over cycling cadence has been a component of this battle [1].
Box 1: The power of Indurain In a 2012 paper, scientists from the USP Araba Sport Clinic in Spain studied the 5-time Tour de France winner and Olympic Champion Miguel Indurain some 14 years after his retirement from professional cycling (1).As part of this study, they gathered data from his racing years - data that makes impressive reading.
Due to this high cadence, cyclists riding the 21 stages of the Tour de France - which takes around 85 hours to complete - will perform more than 500,000 crank revolutions.
The average cadence in the Tour de France depends on the stage and event. But you can expect professional riders to ride anywhere between 75-95 RPM (on average). Is higher cadence better cycling? Cycling at higher cadences reduces muscular fatigue and increases aerobic recruitment, allowing you to ride more efficiently for longer.
The multiple benefits of a higher cadence are demonstrated with an example offered by Froome at the 2015 Tour de France. Tim Kerrison, Team Sky's Head of Performance, released Froome's power data for Stage 10. Froome completed the 15.3 km climb to La-Pierre-Saint-Martin in a time of 41 minutes, 30 seconds, at an average cadence of 97 rpm ...
The average speed of winner Jonas Vingegaard for the 21-stage race set a new record at 42.03km/h (26.12mph) Combining every edition of the Tour since 2007, the average pace of the winner has been ...
If you watch an old Tour de France stage (and I mean old, like circa 1990), you'll notice a big difference in the riders' cadence—practically all the guys back then would slap it in the biggest gear possible and grind away. It was thought that if you could ride the biggest gear for longer, then you'd go the fastest.
A Tour de France soigneur might mix between 40 and 120 bottles for the team on each stage, which means an individual rider may throw back up to a dozen bottles or more. Average Rider: 1 to 2 Tour ...
An exclusive look inside the personalised data pages of the Stages Dash M50 used by the Slovenian throughout his 2020 Tour de France campaign. ... cadence and average cadence follow immediately ...
POWER OUTPUT: 300 WATTS. During a normal stage of the Tour de France, pro riders can pump out around 230-250 watts on average, which equates to burning about 900 calories per hour. But on some of the harder stages they can average over 300 watts, or 1,100 calories per hour. Tadej Pogačar has a Functional Threshold Power - an estimate of the ...
The heaviest Tour de France rider since 2000 was the Swede Magnus Backstedt, who says: "I had to be the lightest I could be for the Tour, which was around 90kg, and as fit as I could be ...
The general trend at the Tour de France, since its start in 1903, is that the speed of the riders is going up ... Tour de France average speed (last 11 editions) 2009, Alberto Contador: 40.03km/h ...
For many of those early years, average speeds hovered around 25 kilometers per hour, with individual stages often taking several hours to complete. The winner of the very first 1903 Tour de France achieved only 25.7 km/h average speed, while the slowest race was just 24.1 km/h in 1919. In the early years of the Tour, the sport was very much one ...
With three mountains on the route profile for the day, Pogačar tackled the first ascent - the Col de Menté - at a comparative amble, averaging (a still enormous) 369 watts (5.6 W/kg) for 20:33.
However, it's worth noting that Armstrong was later stripped of his titles due to doping. 2003, 2015, 2017, and 2019 Tours are also among the fastest, with average speeds ranging from 40.7 km/h (25.3 mph) to 40.9 km/h (25.4 mph). 2022's Tour de France, won by Jonas Vingegaard, saw a new record set with an average speed of 42.03 km/h (26 ...
Even their starts were similar as they got into the rhythm in the first 10 seconds. Alex averaged 398w, 5.06w/kg and a max of 655w, 9.6w/kg in the first 10sec. Joseph was in a similar effort range as he averaged 543w, 7.43w/kg and a max of 667w, 9.01w/kg. The most noticeable difference in this first part of the stage is the cadence between both ...
The power numbers from this year's Tour de France are the highest in the modern era of cycling. 7w/kg for 20 minutes is the new standard for GC contenders, and many of these performances come after 3500 kJs of work, at 1000-2000 meters above sea level, and in 30+°C (86+°F) temperatures. Unlike 2022, Vingegaard didn't wait long to play his ...
The average speed for professional cyclists while traversing on flat terrain is 25-28 mph. The average amateur cyclist travels about 17-18 mph while on flat ground. For many pro athletes racing in the Tour de France, being able to maintain a fast speed on flat terrain allows them to simply stay competitive with the other athletes.
The quickest time trial was earned by Rohan Dennis during the first stage of the 2015 Tour de France in Utrecht, who triumphed with an average speed of 55.5 km/h (34.5 mph). The 2013 Orica GreenEDGE team holds the record for the fastest stage win in a team time trial. They impressively covered a 25 km time trial at 57.70 km/h.
The average speed was 27.67 km/h between 1919 and 1939, and 40.15 km/h between 1999 and 2019. The average speed of the 2023 Tour de France was 41.43 km/h. Overall Distance and Average Speed. The average speed improved mainly thanks to technological progress, better training methods, and nutrition specialists.
Average speed per stage. The average speed over all stages is 41.408 km/hour. The average speed for the whole race is computed by dividing the total distance by the sum of stage times of the final GC winner. In the last column the average speed up to that stage is shown. This is the average speed for the leader in the race at that stage. Stage.
In 2023, the winner of the Tour de France, Jonas Vingegaard, maintained an average speed of around 41.43 kilometers per hour. The Danish cyclist also won the famous event in 2022, with an average ...